Slide 9 of 20
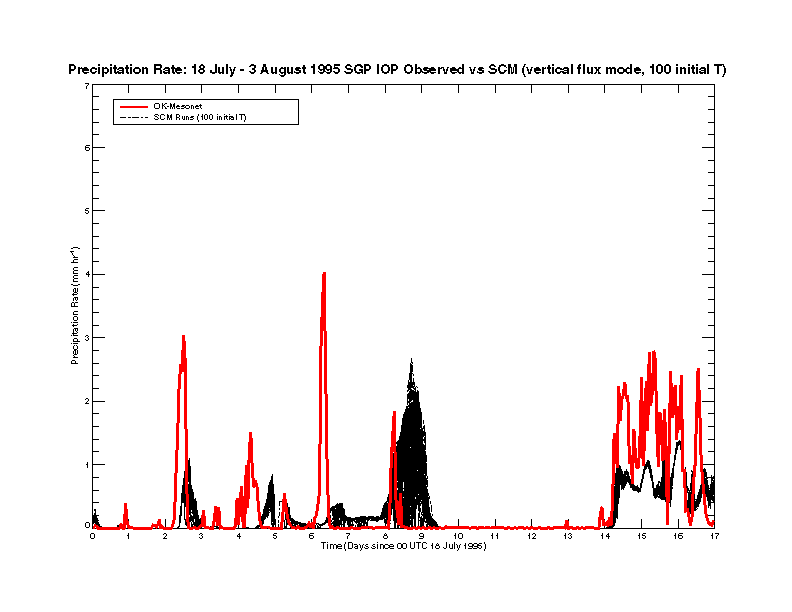
Figure 1.4.a. Time series of the precipitation results of 100 SCM
runs (black lines) versus observational data (red line) for 18 July-3 August
1995 ARM SGP IOP are shown here. Each of the SCM runs was initialized with
a temperature sounding that was perturbed slightly, at random; all other
initialization and prescription data were identical for each run. The SCM
was driven using horizontal advective forcing ("vertical flux mode"). Note
the onset of precipitation observed just after day 8 differs in individual
SCM runs by as much as one day.