This last experiment is the easiest to design since it does not require to simulate the exact or idealized paths of the NOAA-11 and NOAA-12 satellites. The infrared (IR) and microwave (MW) brightness temperatures are computed at each model grid-point, and regularly sampled four times per day at 0, 6, 12, and 18 GMT.
This sampling technique is the least accurate for comparison against satellite data since it ignores the actual path of the satellite. It is also the most expensive since it requires the computation of IR and MW brightness temperatures at each model grid box.
As for the "Exact Orbit" and "Idealized Orbit" simulations, January global maps of simulated brightness temperatures for the 7 IR channels and 4 MW channels are shown in the table below.
CSU GCM (every 6-hour sampling)
|
|
|
|
|
 |
 |
 |
 |
|
|
|
|
 |
 |
 |
|
|
|
|
|
 |
 |
 |
 |
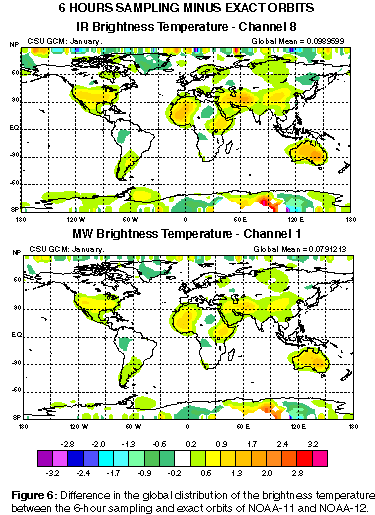
Figure 6 shows the geographical distribution of the difference in the IR (Channel 8) and MW (Channel 1) brightness temperatures between the every 6-hour GMT sampling and the exact satellite orbits.
As for Fig.4 and
Fig.5 , the largest sampling bias occurs at low latitudes over land and results because of the difference in the diurnal sampling of the surface temperature.
