
|

|


Measuring weather
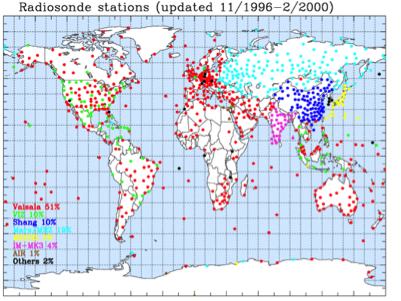 Balloons are released into the air at midnight and noon
Greenwich Mean Time at various locations around the world at over 1000
locations, a globally coordinated launch to provide a snapshot of global
atmospheric conditions. You can see an older map of these stations to the left.
In the United States and related territories, there are
approximately
100 official
launch sites!
Balloons are released into the air at midnight and noon
Greenwich Mean Time at various locations around the world at over 1000
locations, a globally coordinated launch to provide a snapshot of global
atmospheric conditions. You can see an older map of these stations to the left.
In the United States and related territories, there are
approximately
100 official
launch sites!
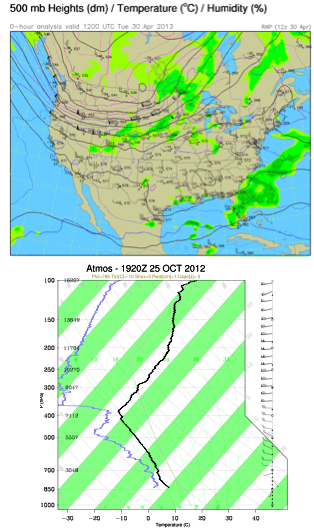 Data are sent to the World Meteorological Organization's Global
Telecommunication System and made available for climate records and weather
forecasting purposes. From there, a number of weather analysis products are
produced. These most frequently are maps like you see to the upper right from
data at various pressure levels and energy diagrams like the "Skew-T" diagram
you see to the lower right. Skew-T diagrams are helpful in gauging the stability
of the atmosphere and can be used by weather professionals who predict clouds
and storms. When soundings are reported, they are entered into an archive for
later use by weather researchers.
Next page
->
in situ, upper air measurements, tethersondes, dropsondes & driftsondes
Data are sent to the World Meteorological Organization's Global
Telecommunication System and made available for climate records and weather
forecasting purposes. From there, a number of weather analysis products are
produced. These most frequently are maps like you see to the upper right from
data at various pressure levels and energy diagrams like the "Skew-T" diagram
you see to the lower right. Skew-T diagrams are helpful in gauging the stability
of the atmosphere and can be used by weather professionals who predict clouds
and storms. When soundings are reported, they are entered into an archive for
later use by weather researchers.
Next page
->
in situ, upper air measurements, tethersondes, dropsondes & driftsondes
Links and resources
Balloons are released into the air at midnight and noon
Greenwich Mean Time at various locations around the world at over 1000
locations, a globally coordinated launch to provide a snapshot of global
atmospheric conditions. You can see an older map of these stations to the left.
In the United States and related territories, there are
approximately
100 official
launch sites!
Data are sent to the World Meteorological Organization's Global
Telecommunication System and made available for climate records and weather
forecasting purposes. From there, a number of weather analysis products are
produced. These most frequently are maps like you see to the upper right from
data at various pressure levels and energy diagrams like the "Skew-T" diagram
you see to the lower right. Skew-T diagrams are helpful in gauging the stability
of the atmosphere and can be used by weather professionals who predict clouds
and storms. When soundings are reported, they are entered into an archive for
later use by weather researchers.
Next page
->
in situ, upper air measurements, tethersondes, dropsondes & driftsondesLinks and resources
